
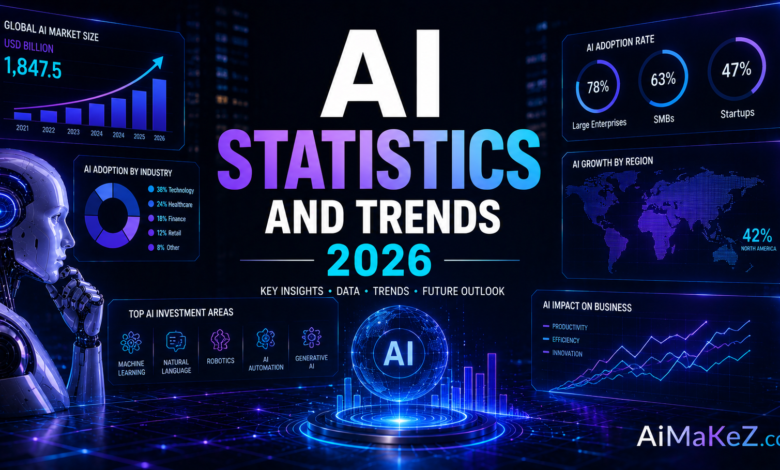
AI Statistics tell a story that headlines often miss, and if you make decisions about budgets, careers, or products, you cannot afford to guess where this technology is heading. Adoption is climbing, spending is surging, and the workforce is being reshaped faster than most forecasts predicted. Yet numbers without context can mislead as easily as they inform. This guide gathers the most important AI statistics and trends for 2026, explains what they actually mean for readers in the United States and Europe, and turns raw data into practical insight you can use today. For related context, read our guide to AI ethics and risks.
Think of this article as a briefing rather than a list of trivia. Behind every percentage point there is a decision waiting to be made, whether it is a company choosing where to automate first or a professional deciding which skills to learn next. The best AI statistics do not simply describe the present; they hint at where the curve is bending so you can position yourself ahead of the shift. Throughout this guide we will keep returning to one question that separates useful data from empty noise: what does this number actually change about the choice in front of you?
Table of Contents
What Are AI Statistics?
AI statistics are quantified measurements that describe how artificial intelligence is developing, being adopted, and affecting the economy and society. They cover everything from market size and investment flows to workplace adoption rates, model performance benchmarks, and public sentiment. In short, they are the scoreboard for a technology that touches nearly every industry.
These figures come from a mix of sources: government agencies, academic research groups, market-research firms, and company earnings reports. Because the field moves quickly, the most useful AI data is recent, clearly sourced, and paired with the methodology behind it.
Understanding these numbers matters because they shape real decisions. Investors weigh adoption curves, executives plan hiring around automation trends, and policymakers craft regulation using workforce projections. When you read AI statistics critically, you move from reacting to hype toward acting on evidence.
It also helps to picture AI statistics as living in layers. The top layer is market data, such as revenue, funding, and valuations, which tells you how much money believes in the technology. Beneath it sits adoption data, which measures how many organizations and individuals actually put AI to work. A third layer captures capability data, including benchmark scores and error rates that reveal how good the models have become. The deepest layer is impact data, covering productivity, employment, and public trust. When you read AI statistics with these layers in mind, you stop treating every headline as equally important and start seeing which numbers describe hype and which describe genuine change on the ground.
Key Features of Reliable AI Statistics
Not every number deserves your trust. The most credible AI data shares a few defining traits.
Clear Sourcing and Methodology
Trustworthy statistics disclose who collected them, when, and how. A figure with a named survey sample and date carries far more weight than an unattributed claim floating around social media.
Recency and Relevance
In a field doubling in capability every year, a statistic from three years ago may already be obsolete. The best AI trends data is refreshed regularly and clearly labeled with its time frame.
Context and Comparability
A raw number means little without a baseline. Strong data shows change over time or against a peer group, so you can tell whether 40 percent adoption is high or low for a given sector.
Segmentation
Useful AI statistics break down by region, industry, and company size. Adoption in a Silicon Valley startup looks nothing like adoption in a European manufacturing firm, and good data respects that difference.
Benefits of Tracking AI Data
Following the numbers delivers concrete advantages. First, it sharpens strategy. When you see which use cases are scaling fastest, you can prioritize investments that match proven demand rather than chasing fads.
Second, it improves forecasting. Reliable adoption and spending trends help finance teams model budgets and help job seekers anticipate which skills will be in demand.
Third, tracking data builds credibility. Whether you are pitching investors, writing a report, or advising clients, evidence-backed claims land harder than opinions. Finally, staying current with AI statistics protects you from expensive surprises, letting you spot a shift, such as rising generative AI usage, before competitors do.
There is a subtler benefit as well: tracking AI data keeps your mental model honest. It is easy to form a strong opinion from a single viral demo or one disappointing experiment, but a habit of checking reliable AI statistics forces you to update those opinions against reality. Over a year, that discipline compounds. You begin to notice when adoption in your industry is accelerating faster than the market average, or when a much-hyped tool is quietly failing to deliver measurable returns. In practical terms, this means fewer wasted budgets, better timed hiring, and pitches that survive tough questions because they rest on evidence rather than enthusiasm.
How AI Statistics Are Collected
Understanding how the numbers are made helps you judge their quality. Here is the typical pipeline behind a headline statistic.
- Define the question. Researchers decide exactly what to measure, such as the share of firms using generative AI in production.
- Choose a sample. A representative group of companies, workers, or users is selected to reflect the wider population.
- Gather the data. Surveys, interviews, platform analytics, or public filings collect the raw responses.
- Clean and weight. Analysts remove errors and adjust the sample so it mirrors real demographics.
- Analyze and interpret. Patterns are calculated, confidence levels checked, and outliers examined.
- Publish with context. The final figures are released alongside methodology so readers can judge reliability.
Reputable trackers like the Stanford AI Index follow this rigor, which is why their reports anchor so many discussions about the state of the field.
Real-World Use Cases
AI statistics are not just for analysts. They guide practical decisions across every function.
Business Strategy
Leaders use adoption and ROI data to decide where to deploy AI first. Seeing that customer-service automation delivers fast payback, for instance, helps a company sequence its rollout for early wins.
Marketing and Advertising
Marketers cite AI usage statistics to justify budgets and benchmark performance. Data showing rising consumer comfort with AI-assisted shopping shapes campaign design and personalization strategy.
Content Creation
Writers and agencies track how many teams now use generative tools and how audiences respond. These numbers inform workflow choices and help set realistic expectations for quality and disclosure.
Education
Schools and universities monitor student and teacher AI adoption to design curricula. Statistics on AI literacy gaps help institutions target training where it is most needed.
Productivity and Automation
Operations teams rely on efficiency statistics to justify automating repetitive tasks. Data linking AI tools to measurable time savings turns a vague promise into a fundable business case.
Healthcare and Research
Hospitals and research labs lean on AI statistics to weigh where automation is safe and where human judgment must stay in charge. Data on diagnostic accuracy, administrative time savings, and patient outcomes helps clinical leaders decide which tools to trust. When adoption figures show that AI-assisted imaging is reducing review times without raising error rates, decision-makers gain the confidence to scale a pilot into standard practice, always keeping regulatory and ethical guardrails in view.
Finance and Risk
Banks, insurers, and investment teams treat AI statistics as an early-warning system. Numbers on fraud-detection performance, model accuracy, and adoption across peer institutions shape both strategy and compliance. Because financial regulators watch AI closely, especially in Europe, firms track not only how much value a model adds but also how transparent and auditable it is. In this sector, a statistic about explainability can matter as much as one about return on investment.
Top AI Trends and Numbers for 2026
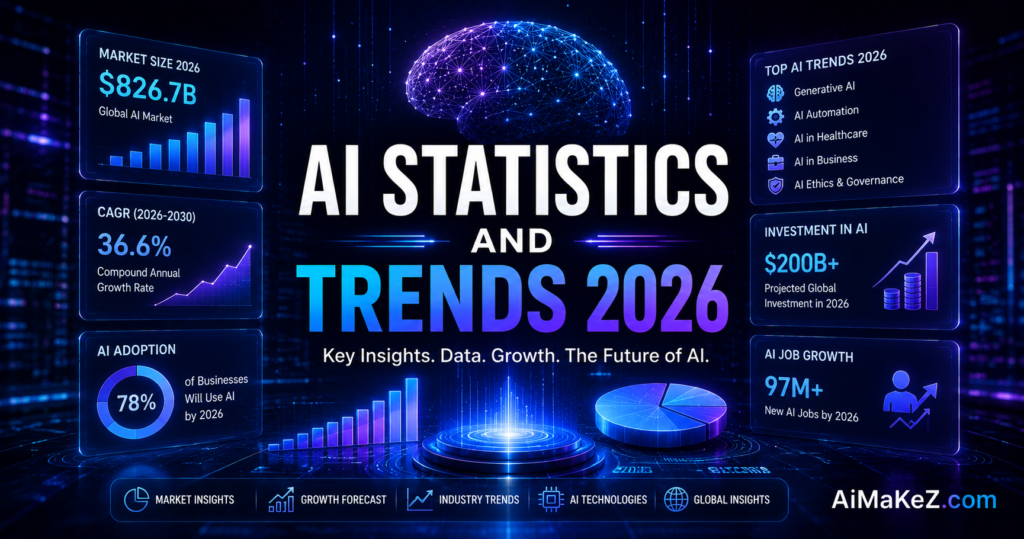
Several patterns stand out as the year unfolds. Generative AI has moved from experiment to standard tool, with a majority of large enterprises reporting active deployment rather than pilots. Investment continues to concentrate in infrastructure, especially the chips and data centers that power large models.
Agentic AI, systems that can plan and complete multi-step tasks, is the fastest-rising trend, shifting the conversation from chatbots to autonomous workflows. At the same time, the workforce story is one of augmentation: most roles are being reshaped rather than eliminated, with demand rising for people who can manage and audit AI systems. Regulation is tightening in Europe, adding compliance to the list of metrics leaders now track alongside adoption and spend.
Two more numbers deserve attention this year. First, the gap between experimenting with AI and operationalizing it is narrowing, as more organizations report that generative tools have moved into day-to-day workflows rather than isolated tests. Second, the cost curve for running capable models keeps falling, which lowers the barrier for small and mid-sized firms that were priced out only a year or two ago. Together these AI statistics suggest that 2026 is less about whether to adopt and more about how thoughtfully and quickly to do so.
Regional Breakdown: United States vs. Europe
One of the most useful ways to read AI statistics is to compare regions, because the same technology plays out very differently on either side of the Atlantic. In the United States, the story is largely one of speed and scale. Private investment is concentrated, big platforms move fast, and adoption in software, marketing, and customer service tends to run ahead of the global average. American firms often prioritize rapid deployment and competitive advantage, accepting a degree of trial and error as the cost of moving first.
Europe tells a more measured story. Adoption is real and growing, but it is shaped by a stronger emphasis on regulation, data protection, and workforce consultation. With rules such as the EU AI Act setting expectations for transparency and risk management, European AI statistics increasingly track compliance readiness alongside raw adoption. For a manufacturer in Germany or a bank in France, the relevant question is not only “how much productivity can AI add” but also “can we deploy it in a way that is auditable and lawful.” This is why applying U.S. figures directly to a European context, or the reverse, so often leads to poor conclusions.
The practical takeaway is simple: whenever you cite an AI statistic, note the region it describes. A 60 percent adoption rate in one market may coincide with 35 percent in another, and both can be accurate. Reading the numbers side by side, rather than blending them into a single global average, gives you a far more honest picture of where the technology stands and how fast it is likely to move in your own market.
Pros and Cons
Relying on AI statistics has clear strengths and a few honest limitations. The table below summarizes both.
| Pros | Cons |
|---|---|
| Grounds decisions in evidence, not hype | Data can lag fast-moving reality |
| Reveals trends before they become obvious | Methodologies vary in quality |
| Strengthens pitches and reports | Numbers can be cherry-picked to mislead |
| Helps benchmark against peers | Requires interpretation to be useful |
| Supports realistic forecasting | Premium reports can be costly |
Pricing of AI Data Sources
Accessing quality AI statistics ranges from free to expensive. Knowing the tiers helps you budget your research.
- Free public reports: The Stanford AI Index, OECD, and many government datasets are available at no cost and offer excellent baseline data.
- Freemium research: Firms often publish headline findings free while reserving detailed breakdowns for paying clients.
- Premium market research: In-depth reports from major analyst firms can run from hundreds to several thousand dollars each.
- Enterprise subscriptions: Continuous data access and custom analysis command annual contracts, typically the largest research expense.
For most readers, free authoritative sources combined with selective premium reports strike the best balance of cost and depth.
Comparison With Alternatives
How does relying on formal AI statistics compare with other ways of gauging the market? Here is a quick look.
| Approach | Strength | Weakness |
|---|---|---|
| Formal AI statistics and reports | Rigorous, comparable, credible | Can lag and may cost money |
| Anecdotes and case studies | Rich, concrete detail | Not representative of the whole |
| Social media sentiment | Fast and current | Noisy and easily skewed |
| Vendor marketing claims | Highlights capabilities | Biased toward the seller |
The smartest analysts blend rigorous statistics with real examples, using data for the big picture and stories for the human detail.
Best Practices for Using AI Statistics
These expert habits will help you use AI data responsibly and effectively.
- Always cite the source and date. Transparency builds trust and lets readers verify your claims.
- Prefer primary sources. Go to the original report from institutions like the OECD rather than a secondhand summary.
- Check the methodology. A small or biased sample can distort even an impressive-looking figure.
- Compare multiple sources. When several independent studies agree, confidence rises.
- Update regularly. Refresh your key statistics at least once a year in this fast-moving field.
- Present context, not just numbers. Explain what a figure means and why it matters to your audience.
One more practice separates careful analysts from casual ones: triangulate before you commit to a figure. Rather than trusting a single striking statistic, look for two or three independent sources that point in the same direction. If a government dataset, an academic index, and a respected market-research firm all show adoption rising, you can cite the trend with confidence even if their exact percentages differ. When sources disagree sharply, treat that disagreement as a signal to dig into definitions and methodology rather than simply picking the number that best supports your argument.
Common Mistakes to Avoid
Even data-savvy people fall into these traps when working with AI statistics.
- Quoting stale figures. Repeating a number from years ago as if it still holds undermines credibility.
- Ignoring sample size. A dramatic percentage from a tiny survey can be meaningless.
- Confusing correlation with causation. Two trends rising together does not prove one caused the other.
- Cherry-picking data. Choosing only figures that support your view distorts reality and erodes trust.
- Skipping the source. An uncited statistic is impossible to verify and easy to doubt.
- Overgeneralizing. Applying U.S. data to Europe, or one industry’s numbers to another, leads to bad conclusions.
Frequently Asked Questions
Where can I find reliable AI statistics for 2026?
Reliable AI statistics come from primary sources such as the Stanford AI Index, the OECD, government agencies, and reputable market-research firms. Always check that a figure names its source, sample, and date before you cite it.
What is the biggest AI trend in 2026?
The fastest-rising trend is agentic AI, systems that plan and complete multi-step tasks autonomously, moving beyond simple chatbots. Alongside it, generative AI has shifted from pilots to standard enterprise deployment, and infrastructure investment continues to surge.
Is AI really replacing jobs according to the data?
The data points to augmentation more than replacement. Most roles are being reshaped as AI takes over specific tasks, while demand grows for people who build, manage, and oversee AI systems. Net job impact varies by industry and region.
How often should AI statistics be updated?
Because the field evolves rapidly, you should refresh key AI statistics at least once a year, and ideally check for major updates every quarter. Always label figures with their time frame so readers know how current they are.
Why do different AI reports show different numbers?
Differences arise from varying definitions, samples, regions, and time frames. One study may count any AI use while another counts only production deployment. Comparing methodologies explains most discrepancies and helps you choose the most relevant figure.
Are AI statistics different for small businesses and large enterprises?
Yes, and the difference matters. Large enterprises usually report higher adoption because they have the budgets, data, and specialist teams to deploy AI at scale. Small businesses often adopt through off-the-shelf tools rather than custom systems, so their AI statistics can look lower even when real-world usage is meaningful. When you read a figure, check whether it is segmented by company size before applying it to your own situation.
Can I trust AI statistics from vendor websites?
Treat vendor figures with healthy caution. Companies selling AI tools have every incentive to highlight the most flattering numbers, so their statistics can be accurate yet selectively framed. Use them for a sense of what a product claims to achieve, then verify any decision-shaping figure against a neutral source such as the Stanford AI Index, the OECD, or a government dataset.
Final Verdict
AI Statistics are the clearest window we have into a technology reshaping economies across the United States and Europe. In 2026, the data points to accelerating adoption, the rise of agentic systems, heavy infrastructure investment, and a workforce being augmented rather than erased. But numbers only help when you read them critically, source them carefully, and pair them with context.
My recommendation is to build a small habit around data: bookmark two or three authoritative trackers, refresh your key figures each quarter, and always ask who measured a number and how. Blend rigorous statistics with real-world examples, avoid stale or cherry-picked figures, and you will make decisions grounded in evidence instead of noise. In a market crowded with hype, disciplined use of AI statistics is one of the most reliable advantages you can give yourself.
Ultimately, the value of AI statistics lies not in the figures themselves but in the clarity they bring to hard choices. The organizations and individuals who thrive in 2026 will not be those who memorize the biggest numbers, but those who ask sharper questions of every statistic they meet: who measured it, when, where, and what it means for the decision at hand. Treat data as a compass rather than a headline, keep your sources current, and let evidence, not excitement, guide your next move in an AI-driven economy.